
S’More Tech Summer Camp, Day 15 (Infographics)
Hi campers!
We’ve been talking around the campfire all week about infographics. Here’s a round-up of more resources to help you incorporate them into your library instruction.
Let’s start with an infographic about infographics, from Rick Mans.

Infographics as a Creative Assessment from Kathy Schrock on Vimeo.
Tech Chef 4 U has super ideas for 8 different learning centers for infographics. These centers are about learning from infographs provided by you, the teacher.
Most of the sites I looked at for CREATING infographics were wayyy too difficult for elementary school students. I thought there would be a snappy web 2. 0 tool for us to use, but if it’s out there, I couldn’t find it. After hours of searching.
I did find one site that I think elementary students can use to create a pictograph. It’s from the United Kingdom, and it allows you to choose the object, color, and units for your pictogram. Then you input your data, and the pictogram is created as you go.
Here’s my graph of library circulation, built with this UK pictogram site.
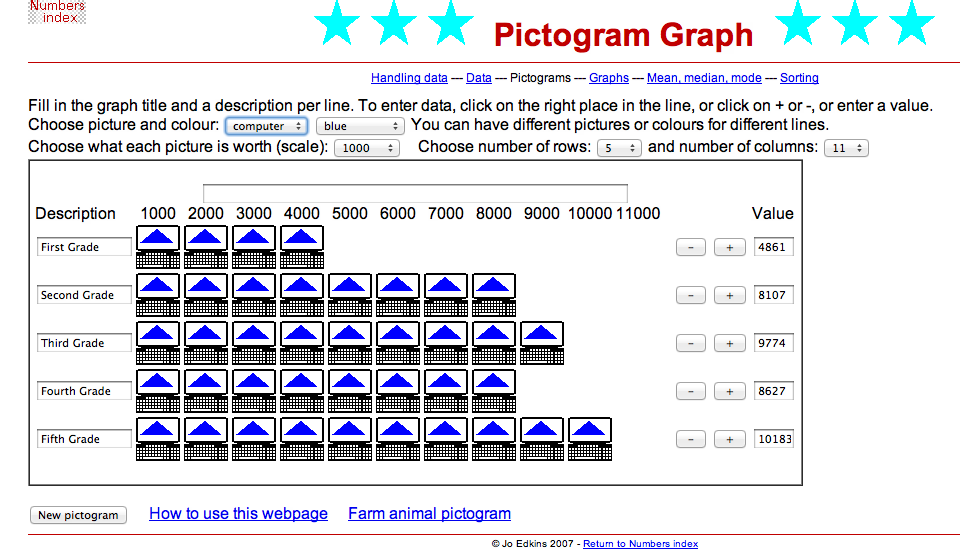
It is free, does not require a login, but you will have to use a screen print or screen shot to save the pictogram.
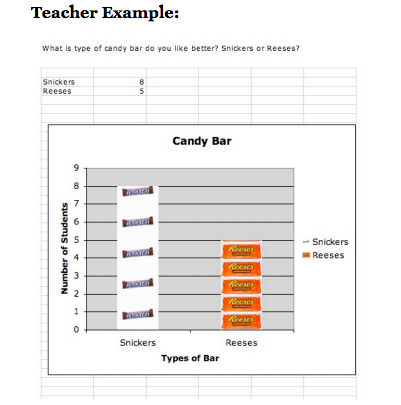
And here is a super lesson plan for using Excel to create a pictograph. Here’s an example of what you can create with this method.
And we saw on Day 12 that you can create a graph in Google documents.
If you have more great ideas for incorporating infographics into library instruction, or you know of an infographic-creating tool that is simple enough for elementary students to use, please share!


I have loved reading this series! I’ve gotten a lot of great new ideas for next year; thanks!
I’ve nominated you for the One Lovely Blog Award! Come over to my blog to pick it up. Thanks for being an inspiration!
Lynn
Inside this Book
Thanks, Lynn! I appreciate your encouraging words!